Financial bubbles have followed the same script for four centuries. From Dutch tulip fields in 1637 to Wall Street trading floors in 2008, the pattern is remarkably consistent: a genuine opportunity appears, greed amplifies it beyond reason, and the inevitable collapse leaves fortunes in ruins. Understanding how financial bubbles form is the first step toward recognizing the next one.
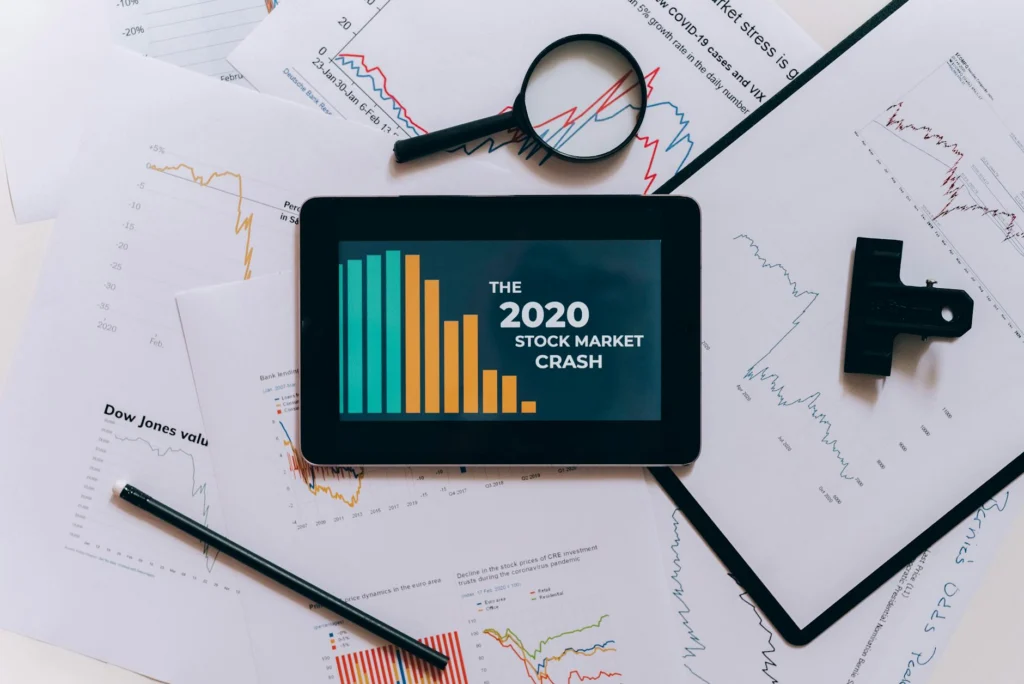
Financial Bubbles Follow 5 Stages
Economist Charles Kindleberger, drawing on the work of Hyman Minsky, described the anatomy of financial bubbles in his landmark book Manias, Panics, and Crashes. The pattern unfolds in five stages: displacement, boom, euphoria, distress, and revulsion[s].
The cycle begins with something real. A new technology, a new market, or a policy shift creates genuine profit opportunities[s]. Early investors make real money. That success draws more capital, and credit expands to fuel the boom. Then euphoria takes over: prices are extrapolated indefinitely, and the argument that “this time is different” gains believers. When the first cracks appear, the smart money exits. Finally, panic sets in. Prices collapse, leveraged positions are liquidated, and fraud that was invisible during the boom becomes visible in the bust.
This is not a modern phenomenon. Stanford economist Peter Koudijs defines a bubble as a situation “where investors buy an asset not for its fundamental value, but because they plan to resell, at a higher price, to the next investor”[s]. That description fits markets across centuries.
Tulip Mania: The Original Financial Bubble
The first well-documented speculative mania struck the Dutch Republic in the 1630s. Tulip bulbs, particularly rare varieties infected by a virus that created spectacular color patterns, became objects of frenzied speculation. A futures market emerged in local pubs, where it was “normal for florists to sell tulips they could not deliver, to buyers who did not have the cash to pay for them and who had no desire to plant them”[s].
The mania peaked in January 1637, when newcomers mortgaged their goods and tools to join the trade[s]. A single auction on February 5 raised 90,000 guilders, at a time when the wealthiest merchants might accumulate half a million guilders in a lifetime[s]. Days later, the crash began at an auction in Haarlem: the first offer of bulbs received no bids, the price was lowered, still no bids, then lowered again[s]. Bulbs that had commanded fortunes sold for 1 to 5 percent of their peak value[s].
The South Sea Bubble: When Even Newton Got Burned
In 1720, the South Sea Company took over England’s war debt in exchange for exclusive trading rights with South America. Shares rose from £128 in January to over £1,000 by August[s]. The company lent money to investors to buy its own stock, creating a self-reinforcing loop.
Isaac Newton initially played it smart. He sold his shares early, pocketing a 100% profit of £7,000. But swept up in the enthusiasm, he jumped back in at a much higher price and lost £20,000[s]. He reportedly muttered that he “could calculate the motions of the heavenly bodies, but not the madness of the people”[s].
By December 1720, shares had collapsed to around £185[s]. Investors who bought on credit faced bankruptcy, and the rate of suicides spiked[s].
The Dot-Com Bubble: Financial Bubbles Go Digital
The internet was a real displacement: a genuinely transformative technology. But by the late 1990s, the NASDAQ’s price-to-earnings ratio had surpassed 90[s]. The index soared from 751 in January 1995 to a peak of 5,048 on March 10, 2000[s]. Investors ignored fundamentals like profitability and cash flow, betting instead on growth that would never materialize for most companies.
The collapse wiped out more than $5 trillion in market value. The NASDAQ fell by more than 75 percent between March 2000 and October 2002[s]. Companies like Pets.com went from $300 million valuations to zero in under a year[s]. Amazon survived, but its shares dropped from around $100 to $7[s].
2008: The Anatomy Repeats
The subprime mortgage crisis followed the same five stages with textbook precision. The displacement was real: new financial products allowed lenders to extend credit to borrowers who previously could not get mortgages[s]. Private-label mortgage-backed securities provided the funding mechanism[s]. Rising home prices validated the lending, and borrowers who fell behind simply sold or refinanced at higher values.
When prices peaked, that escape route closed. Refinancing and selling homes became unviable, and loss rates began rising for lenders and investors[s]. The panic phase produced the worst financial crisis since the Great Depression.
Why Financial Bubbles Keep Happening
The unsettling truth about financial bubbles is that they are not driven by stupidity. Kindleberger’s framework shows that bubbles are built on genuine opportunity, then extrapolated well beyond what reality can support[s]. During the euphoric phase, the evidence genuinely appears to support the “this time is different” thesis. Skeptics are dismissed not by fools, but by people whose recent experience confirms the new narrative.
Economist Hyman Minsky argued that financial crises are endemic to capitalism because periods of prosperity encourage borrowers and lenders to become progressively reckless[s]. Stability itself is destabilizing. The longer the calm lasts, the more fragile the system becomes[s]. That insight explains why four centuries of experience have not inoculated markets against the next mania.
Financial bubbles are not random events. The Kindleberger-Minsky framework, developed across four decades of research, describes a five-stage anatomy that maps onto speculative manias from the 1630s to the present with uncomfortable precision. Understanding the mechanism behind financial bubbles requires examining both the structural model and its historical confirmation across four centuries of data.
The Kindleberger-Minsky Model of Financial Bubbles
Charles Kindleberger, drawing on Hyman Minsky’s Financial Instability Hypothesis, described the anatomy of a speculative mania in Manias, Panics, and Crashes (1978). The model identifies five stages: displacement, boom, euphoria, distress, and revulsion[s].
Displacement begins with a genuine exogenous change: a new technology, a policy shift, or a market opening that creates real profit opportunities. Critically, the displacement is real; Kindleberger’s bubbles are not built on pure fiction but on genuine opportunity that is then extrapolated beyond what underlying reality can support[s].
Boom follows as early profits attract capital. Credit expansion, often enabled by financial innovation or regulatory relaxation, accelerates the process. Euphoria marks the phase where the boom becomes self-referential: the argument that “this time is different” gains adherents, not because investors are irrational, but because the evidence available in the euphoric phase is genuinely consistent with the thesis[s]. Distress appears when the first cracks emerge: a major institution fails, a fraud surfaces, or prices diverge from projections. Revulsion completes the cycle as prices collapse and the narrative inverts entirely.
Minsky’s Endogenous Instability
Minsky’s contribution was the insight that financial fragility is endogenous, not imposed by external shocks. He identified three progressively fragile borrowing structures[s]:
- Hedge finance: borrowers service both principal and interest from operating cash flows.
- Speculative finance: borrowers service interest but must roll over principal, depending on continued credit access.
- Ponzi finance: borrowers cannot service either principal or interest; solvency depends entirely on rising asset prices.
The transition from hedge to speculative to Ponzi finance is not caused by an external event. Extended calm produces confidence, confidence produces leverage, leverage drives asset appreciation, appreciation validates the leverage, and the cycle reinforces itself until the debt structure becomes unsupportable[s]. Minsky argued that financial crises are endemic in capitalism because prosperity encourages progressively reckless behavior[s].
Tulip Mania (1633-1637): Proto-Bubble with Financial Innovation
The Dutch tulip mania demonstrates the displacement-to-revulsion cycle in its earliest documented form. The displacement was genuine: rare tulip varieties had real aesthetic and social value in a society experiencing post-plague prosperity and rising real wages[s].
Financial innovation accelerated the boom. Promissory notes evolved from a credit mechanism for growers into a leveraged futures market where participants had no stake in the underlying bulbs[s]. The euphoria phase peaked in January 1637, when newcomers mortgaged tools and savings to enter. A single auction on February 5 raised 90,000 guilders[s]. Revulsion struck within days at a Haarlem auction: no bids at any price[s]. Terminal valuations settled at 1 to 5 percent of peak[s].
The South Sea Bubble (1720): Leverage and Reflexivity
The South Sea Company’s displacement was a debt-for-equity swap: Parliament granted exclusive trading rights in exchange for absorbing the national debt[s]. Shares rose from £128 in January to over £1,000 in August 1720[s]. The company accelerated the boom by lending money to investors to purchase its own shares, creating a reflexive feedback loop.
Even Isaac Newton, who initially sold at a 100% profit of £7,000, re-entered the market near the peak and lost £20,000[s]. The crash sent shares to £185 by December, triggered widespread bankruptcy, and spiked the suicide rate[s]. Combined with the Mississippi Bubble in France, it produced the first international stock market crash[s].
The Dot-Com Bubble (1995-2002): Displacement Without Earnings
The internet was a textbook displacement: a genuinely transformative technology. The NASDAQ rose from 751 in January 1995 to 5,048 on March 10, 2000[s]. Euphoria disconnected valuations from fundamentals entirely; the NASDAQ’s P/E ratio exceeded 90 by 1999[s]. The Fed’s rate tightening in early 2000 triggered distress[s], and by October 2002 the NASDAQ had fallen more than 75 percent, erasing $5 trillion in value[s].
The Subprime Crisis (2007-2010): Minsky in Real Time
The 2008 crisis followed the Minsky progression with particular clarity. The displacement was financial innovation: private-label mortgage-backed securities allowed lenders to extend credit to previously excluded borrowers[s]. The boom was genuine: homeownership expanded and rising prices validated the lending model.
The transition to Ponzi finance occurred through interest-only mortgages, option ARMs, and NINJA loans, which represented the endogenous response to a long period of stability and rising prices[s]. Borrower solvency depended entirely on continued appreciation. When prices peaked, refinancing became unviable and loss rates climbed[s]. The Minsky moment arrived in 2007 as the entire leveraged structure unwound faster than any single institution could manage.
The Structural Lesson of Financial Bubbles
Across these four cases, the anatomy holds. Every bubble begins with a real displacement. Every boom is accelerated by credit expansion and financial innovation. Every euphoria phase produces its own confirming evidence. And every collapse reveals the fragility that stability itself created.
Minsky’s deepest insight remains the most uncomfortable: the conditions for the next crisis are typically being created by the policy response to the last one[s]. Kindleberger gave us a diagnostic map, not a predictive GPS. It does not tell us when transitions happen, but it provides the ability to recognize the terrain[s]. Four centuries suggest that is more than most market participants have.