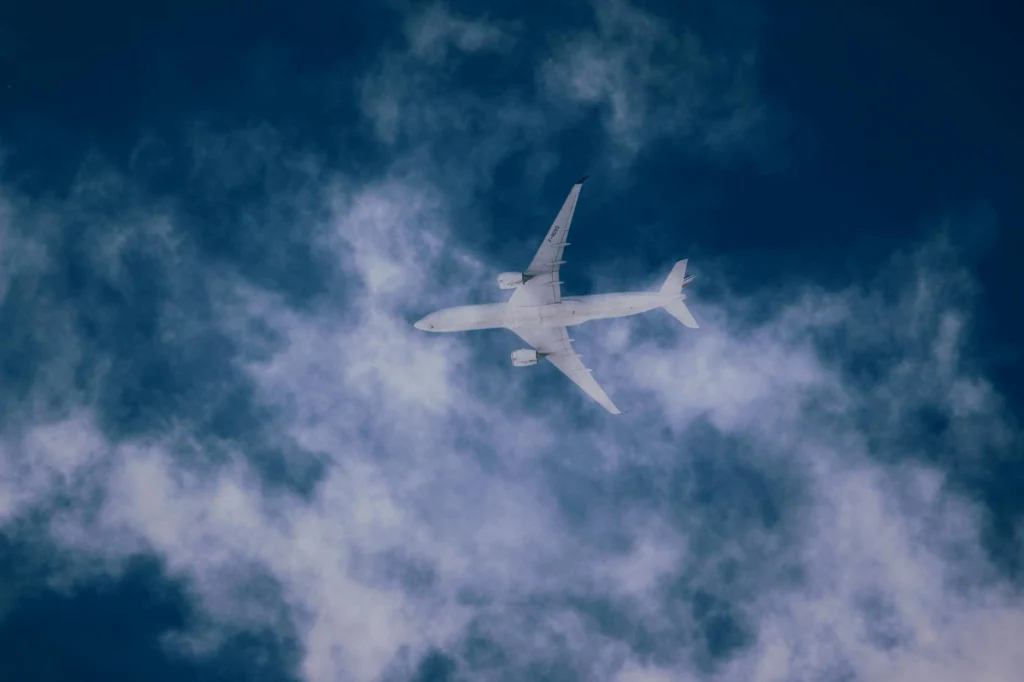
Clear-air turbulenceSudden aircraft turbulence in cloud-free skies with no radar warning, caused by invisible wind shear at cruising altitude. Often abbreviated CAT., the invisible atmospheric hazard that pilots cannot see and passengers cannot brace for, has gotten measurably worse over the past four decades. The culprit is not a mystery: the same warming that is reshaping coastlines and wildfire seasons is also restructuring the rivers of fast-moving air at cruising altitude.
The technical name is clear-air turbulence, or CAT. Unlike the turbulence you hit flying through a thunderstorm, CAT happens in perfectly clear skies. There is no cloud to warn pilots, no radar signature to dodge. The plane just drops, or shakes, without warning. On May 21, 2024, Singapore Airlines Flight SQ321 from London to Singapore hit severe turbulence over Myanmar, killing a 73-year-old passenger and injuring more than 70 others. That particular incident involved convective turbulence near thunderstorms, but it threw a spotlight on a broader trend: the skies are getting rougher.
Clear-air turbulence by the numbers
In 2023, a team led by Mark Prosser at the University of Reading published the first global observational study of CAT trends from 1979 to 2020. Over the North Atlantic (one of the world’s busiest flight corridors), they found that the annual duration of severe clear-air turbulence increased by 55%, from 17.7 hours per year to 27.4 hours. Moderate turbulence rose by 37%. Even light turbulence climbed 17%.
A follow-up study in 2024 by Mohamed Foudad, also at Reading, extended the analysis across the entire Northern Hemisphere. Using 41 years of atmospheric data and 11 climate models, Foudad’s team found that moderate-to-severe CAT increased between 60% and 155% over North Africa, East Asia, the Middle East, the North Atlantic, and the North Pacific. The increases tracked with rising global temperatures, and the models project the trend will continue with each additional degree of warming.
Why warming makes turbulence worse
Here is the basic mechanism. Clear-air turbulence is generated by wind shearA sudden change in wind speed or direction between adjacent atmospheric layers, which can destabilize airflow and produce turbulence.: the difference in wind speed or direction between two layers of the atmosphere stacked on top of each other. The jet streams (those narrow bands of fast-moving air at around 30,000 to 40,000 feet) are the primary generators. When the shear across a jet stream gets strong enough, the smooth airflow breaks down into chaotic eddies, and anything flying through them gets shaken.
Climate change intensifies this process through an uneven pattern of warming. The Arctic is heating roughly two to four times faster than the global average. This changes the temperature gradient between the equator and the poles, which is the fundamental engine driving the jet streams. Research has measured a 15% increase in vertical wind shear in the upper atmosphere over the North Atlantic since 1979. More shear means more turbulence. It is a direct, physical chain: more CO₂, more warming, altered temperature gradients, stronger wind shear, rougher flights.
What this means in practice
Turbulence is not just uncomfortable; it is the leading cause of weather-related aviation injuries. According to Mohamed Foudad’s research, clear-air turbulence alone accounts for approximately 70% of all weather-related aviation accidents over the United States. The FAA recorded 20 serious turbulence injuries in 2023, the highest single-year count in their tracking data. Flight attendants bear the greatest risk: they are roughly 24 times more likely to suffer serious injuries from turbulence than seated passengers, because they spend much of the flight standing and serving.
The financial cost is significant too. Mark Prosser has cited estimates ranging from $150 million to $500 million per year in the United States alone, covering injuries, aircraft inspections, maintenance, and rerouting. And CAT is uniquely expensive because it is uniquely hard to predict. You can see a thunderstorm on radar and fly around it. You cannot see clear air.
Can anything be done?
The good news: modern commercial aircraft are engineered to withstand turbulence far beyond what passengers experience, even in severe events. The structural risk to the airplane is low. The risk is to the humans inside it, particularly those not wearing seatbelts.
On the forecasting side, atmospheric scientists are working on better prediction tools. Current turbulence forecasts rely on numerical weather models that estimate wind shear patterns, combined with pilot reports. But CAT forecasting remains imprecise, especially for severe events. Paul Williams at the University of Reading, who has spent over a decade on this problem, has noted that turbulence along busy flight routes could “double or treble or quadruple over the next few decades,” making improved detection a priority rather than a luxury.
For passengers, the practical advice has not changed, but the urgency behind it has: keep your seatbelt fastened whenever you are seated, even when the sign is off. That single habit remains the most effective protection against an invisible hazard that is becoming more common.
Clear-air turbulenceSudden aircraft turbulence in cloud-free skies with no radar warning, caused by invisible wind shear at cruising altitude. Often abbreviated CAT. (CAT), the invisible atmospheric hazard generated by wind shearA sudden change in wind speed or direction between adjacent atmospheric layers, which can destabilize airflow and produce turbulence. outside convective systems, has been measurably intensifying over the past four decades. Two landmark observational studies from the University of Reading have quantified this trend and linked it directly to anthropogenic climate change, confirming what models had predicted since at least 2013.
Observational evidence: Prosser et al. (2023)
The first comprehensive global observational analysis of CAT trends was published in Geophysical Research Letters in June 2023 by Mark Prosser, Paul Williams, Graeme Marlton, and R. Giles Harrison. Using ERA5 reanalysis data from 1979 to 2020, they applied the Ellrod Turbulence Index (a diagnostic combining vertical wind shear and horizontal deformation) to quantify turbulence probability at aircraft cruising altitudes.
At a representative point over the North Atlantic (a region chosen for its density of transatlantic flight traffic and its position within the polar jet stream), the results were unambiguous:
- Light-or-greater CAT: +17% (466.5 → 546.8 hours/year)
- Moderate-or-greater CAT: +37% (70.0 → 96.1 hours/year)
- Severe-or-greater CAT: +55% (17.7 → 27.4 hours/year)
The monotonic increase across all severity thresholds is notable: the more severe the turbulence category, the larger the relative increase. This is consistent with the physical expectation that wind shear intensification preferentially pushes marginal events above higher severity thresholds, a nonlinear amplification effect.
Hemispheric analysis: Foudad et al. (2024)
Mohamed Foudad and colleagues expanded the scope in a study published in the Journal of Geophysical Research: Atmospheres in July 2024. Analyzing 41 years of atmospheric reanalysis data (1980-2021) alongside an ensemble of 11 CMIP6 climate models with 20 simulations spanning 1°C to 4°C of warming above preindustrial baselines, they quantified regional trends across the entire Northern Hemisphere.
Key findings:
- Moderate-to-severe CAT increased between 60% and 155% over North Africa, East Asia, the Middle East, the North Atlantic, and the North Pacific over the 41-year study period.
- East Asia currently experiences the highest frequency of moderate-to-severe CAT at approximately 7.5% of the time, compared to the hemispheric average of roughly 1%.
- The probability of encountering moderate-to-severe CAT increases with each degree of global warming above preindustrial levels, with the relationship holding across all 11 models tested.
The physical mechanism: wind shear amplification
CAT is generated when the Richardson number (Ri), the ratio of static stability to vertical wind shear squared, drops below a critical threshold (typically Ri < 0.25 for the onset of Kelvin-Helmholtz instability). The relevant equation is:
Ri = N² / (du/dz)²
where N² is the Brunt-Väisälä frequency (a measure of atmospheric static stability) and du/dz is the vertical wind shear.
Climate change affects both terms, but the shear term dominates. Arctic amplificationThe phenomenon in which the Arctic warms two to four times faster than the global average, driven by feedback loops such as sea-ice loss exposing darker ocean. (the preferential warming of polar regions at roughly two to four times the global average rate) modifies the meridional temperature gradient. This gradient is the thermodynamic engine of the jet streams via thermal wind balance. The relationship is expressed as:
∂u/∂z = -(g/fT)(∂T/∂y)
where g is gravitational acceleration, f is the Coriolis parameter, T is temperature, and ∂T/∂y is the meridional temperature gradient. As differential warming alters this gradient at different altitudes, vertical wind shear intensifies in the upper troposphere and lower stratosphere where commercial aircraft cruise. Research using three independent reanalysis datasets has documented a 15% increase in vertical wind shear over the North Atlantic since 1979.
Davide Faranda, research director of climate physics at France’s Laboratoire de Science du Climat et de l’Environnement, has offered a useful analogy: “If you have a small boat and you put it in this river, you will see shaking a lot.” The jet stream is the river; the aircraft is the boat; and climate change is widening and accelerating the current.
Forecasting challenges and operational implications
CAT presents a unique detection problem. Convective turbulence produces radar-visible moisture signatures. Mountain wave turbulence has predictable geographic triggers. CAT, by definition, occurs in cloud-free air with no moisture to scatter radar signals. Current forecasting relies on numerical weather prediction (NWP) models estimating shear and stability fields, supplemented by pilot reports (PIREPs). Both have significant limitations: NWP models lack the resolution to capture mesoscale turbulence-generating processes, and PIREPs are spatially and temporally sparse.
The aviation industry costs are substantial. Mark Prosser has cited estimates of $150 million to $500 million per year in the United States alone for turbulence-related expenses (injuries, aircraft inspections, maintenance, rerouting). The FAA recorded 20 serious turbulence injuries in 2023, the highest single-year figure in their data. Clear-air turbulence accounts for approximately 70% of all weather-related aviation accidents over the United States, according to Foudad’s research.
Paul Williams, who has led the University of Reading’s turbulence-climate research program for over a decade, has projected that turbulence along busy flight routes could “double or treble or quadruple over the next few decades.” Given that current forecasting tools already struggle with CAT detection, the combination of increasing frequency and persistent detection gaps makes improved turbulence nowcastingVery short-range weather forecasting for the next 0–6 hours, using real-time sensor observations rather than relying solely on numerical prediction models. and aircraft-based sensing technologies (such as lidar-based clear-air turbulence detection systems currently in development) increasingly critical infrastructure rather than research curiosities.